SY
SYSun Country Airlines
…2025 Departures
…Load Factor
SY1 hubs
The airports where Sun Country Airlines concentrates the most flights and connections, typically where it bases aircraft and crew.
Find direct flights from any U.S. airport — no booking pressure, no retargeting.
Per-aircraft performance, 2025
How efficiently Sun Country Airlines uses each aircraft type it flies: load factor, seats per flight, and passengers per departure, broken down by airplane model.
2 aircraft types · 2997 routes in 2025
Every route Sun Country Airlines flew in 2025, grouped by the aircraft type assigned to it. A route can appear under more than one selection if Sun Country Airlines swaps equipment on it seasonally.
Highest-volume city pairs by seat volume
The busiest routes Sun Country Airlines flies by total seats, split into domestic and international. Ranked by volume, not necessarily by profitability.
Sun Country's BTS data paints a clear picture of a highly seasonal, Minneapolis-centric operation. Departures spike in winter (Minnesotans heading south) and again around spring break, then taper during summer when the upper Midwest has its own pleasant weather. Load factors are solid for a leisure carrier, reflecting strong advance booking demand from a captive market.
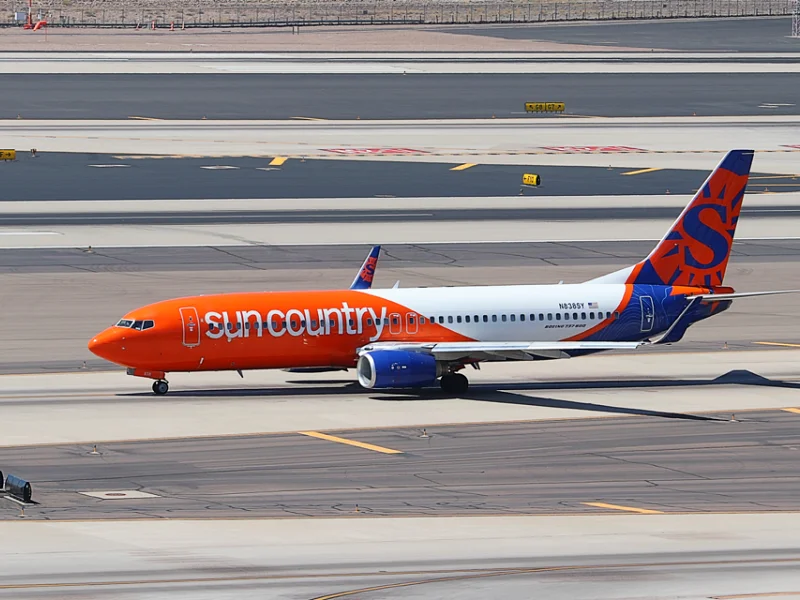
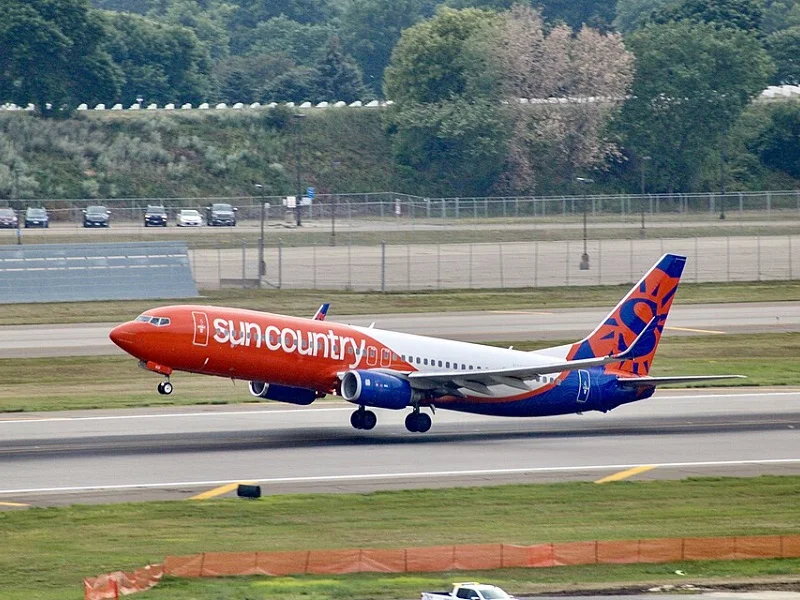
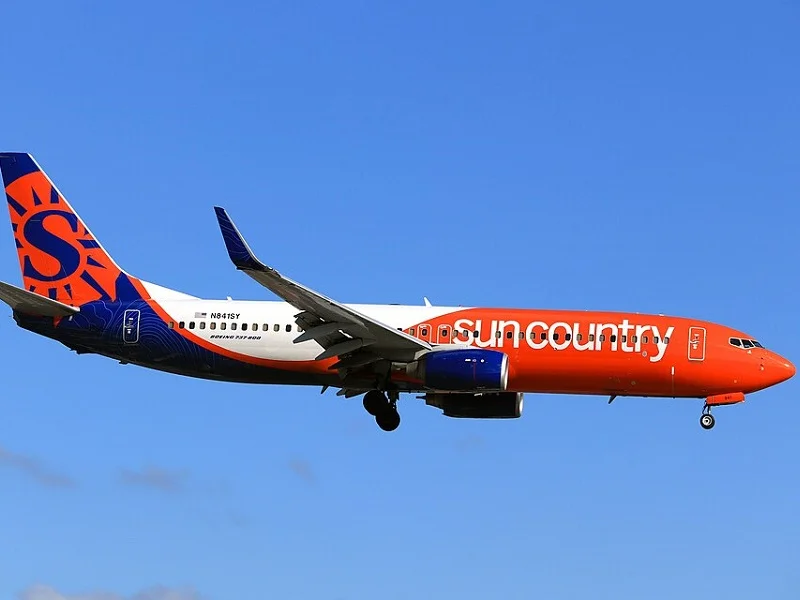
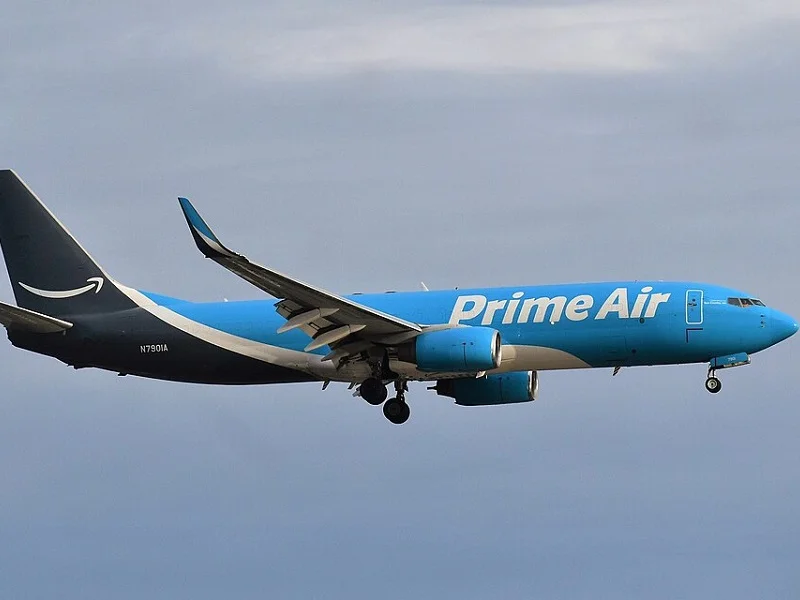
The all-Boeing 737 fleet is relatively straightforward compared to peers, with 737-800s and more recently 737-900ERs making up the operation. Aircraft utilization is modest compared to airlines with year-round consistent demand, a natural consequence of the seasonal model. The Amazon Air cargo operation uses the same aircraft during off-peak passenger hours, which helps offset utilization costs in the fleet data.
Sun Country Airlines is a Minneapolis-based hybrid carrier that occupies a unique position in U.S. aviation. Part leisure ULCC, part cargo operator, Sun Country has built a business around flying Minnesotans to warm weather destinations while simultaneously operating cargo flights for Amazon Air. The dual-revenue model gives Sun Country financial stability that pure passenger ULCCs lack, particularly during seasonally slow periods.
An overwhelming majority of Sun Country's passenger flights originate from Minneapolis-Saint Paul International Airport, making it one of the most hub-concentrated airlines in the country. A merger with Allegiant Air was announced in January 2026, which would combine the two carriers into the one of largest ULCC networks in the United States if completed and approved by regulators.
Sun Country is primarily for Minneapolis-area travelers seeking affordable leisure flights to Florida, Mexico, or the Caribbean. If you live in the Twin Cities metro and want to fly to a warm destination on a budget, Sun Country should be your first check before booking on Delta. Their fares from MSP to leisure destinations are frequently the lowest available by a meaningful margin.
Outside of Minneapolis, Sun Country has limited utility: their network is so MSP-centric that travelers from other cities will rarely find Sun Country a practical option. If you are connecting through MSP or happen to be in a market they serve from a secondary city, it is worth checking, but for most travelers outside Minnesota this airline will not be relevant.
Sun Country flies primarily leisure routes from its Minneapolis base to warm-weather destinations in Florida, the Southwest, Mexico, and the Caribbean, with service that scales up heavily in winter and contracts in summer. The airline also operates Amazon cargo routes alongside its scheduled passenger service, giving it an unusually diversified revenue base for a carrier its size.
Understanding route metrics for Sun Country Airlines
Load factor is the percentage of available seats filled with paying passengers. A route running at 85% or above is considered healthy and signals strong demand relative to capacity. When Sun Country Airlines routes dip below 75%, it often means the airline is over-scheduling relative to demand, which can lead to fare cuts, frequency reductions, or eventual suspension. Routes where the load factor has declined more than 5 points versus the historical average are flagged in our Stability scoring, since sustained low fill rates are one of the strongest early indicators of a route being pulled.
Route Stability reflects how consistently a route has been operated over time and how healthy it looks today. Lower scores, flagging a route as Stability Watch or At Risk, are driven by a combination of factors: declining year-over-year passenger numbers, load factors below 75% (meaning seats are going empty), frequency cuts in 2024–2025 relative to 2023, and a history of suspension during COVID with a slow recovery. A route that Sun Country Airlines skipped during 2020–2021 and never fully restored will carry a resilience penalty that drags the overall stability score down.
Route Dominance looks at Sun Country Airlines's share of that route specifically. It is driven purely by Sun Country Airlines's seat share on each route: Sole Operator means Sun Country Airlines is the only nonstop carrier; Monopoly means it holds over 70% of seats; Dominant means 40–70%; below that falls into Competitive or Minor territory. High dominance on a busy route signals strong pricing power and low substitution risk for travelers.
Airport Commitment scores how deeply invested Sun Country Airlines is at each airport it serves, specifically whether it's growing, holding steady, or pulling back. A Dominant or Committed label means the airline has meaningful seat share, stable or growing capacity, and strong route completion rates at that airport. A Marginal or Retreating label means thin seat share, capacity cuts since 2022, or a pattern of cancellations. Hub airports like Sun Country Airlines's primary bases will always score highest; airports where it operates only one or two seasonal routes will score lowest.