Airlines serving this route
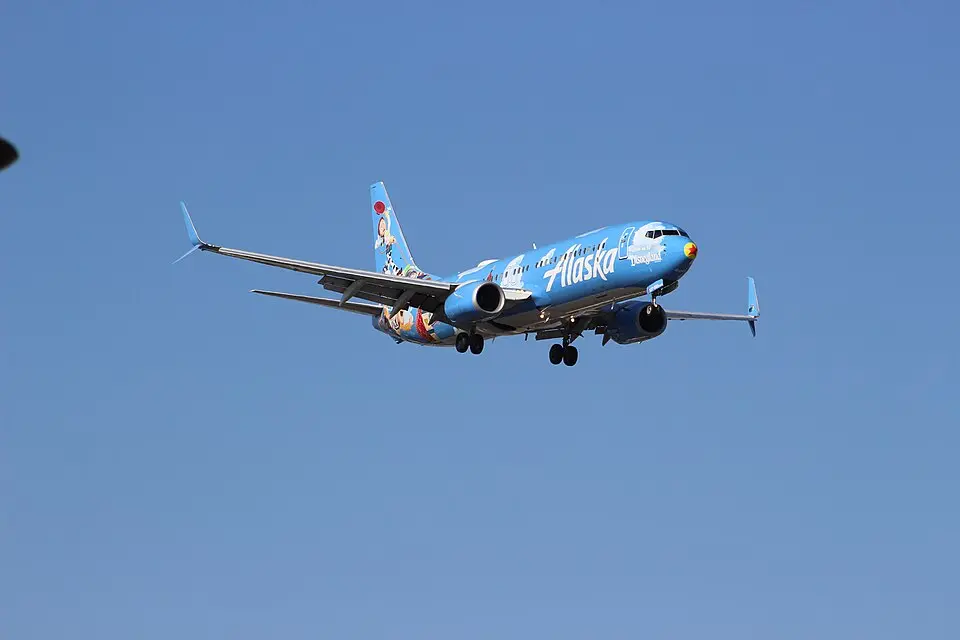
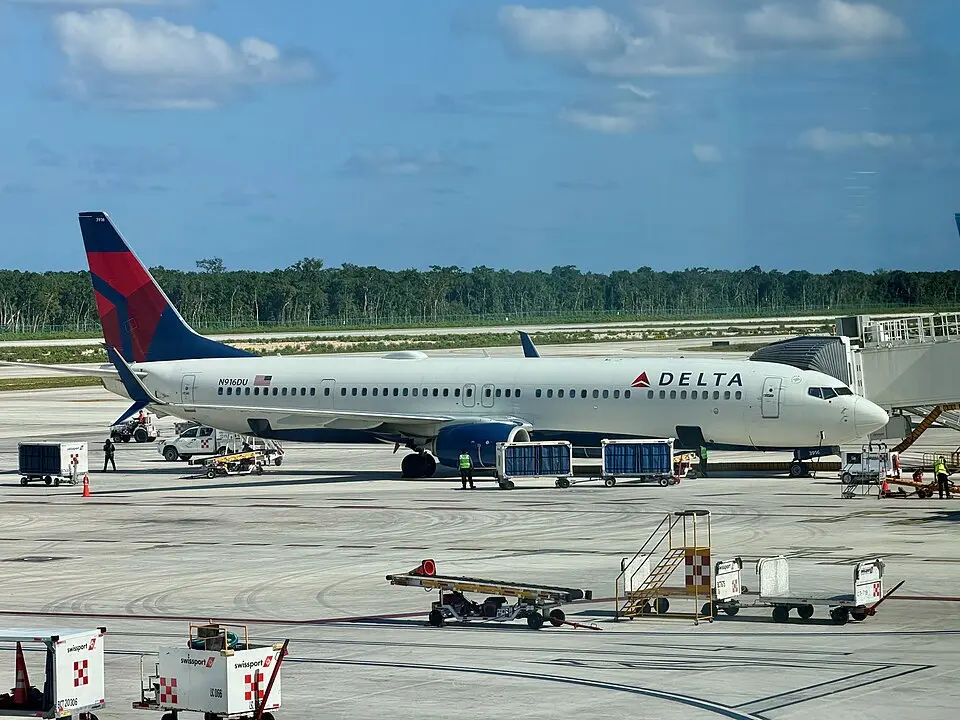
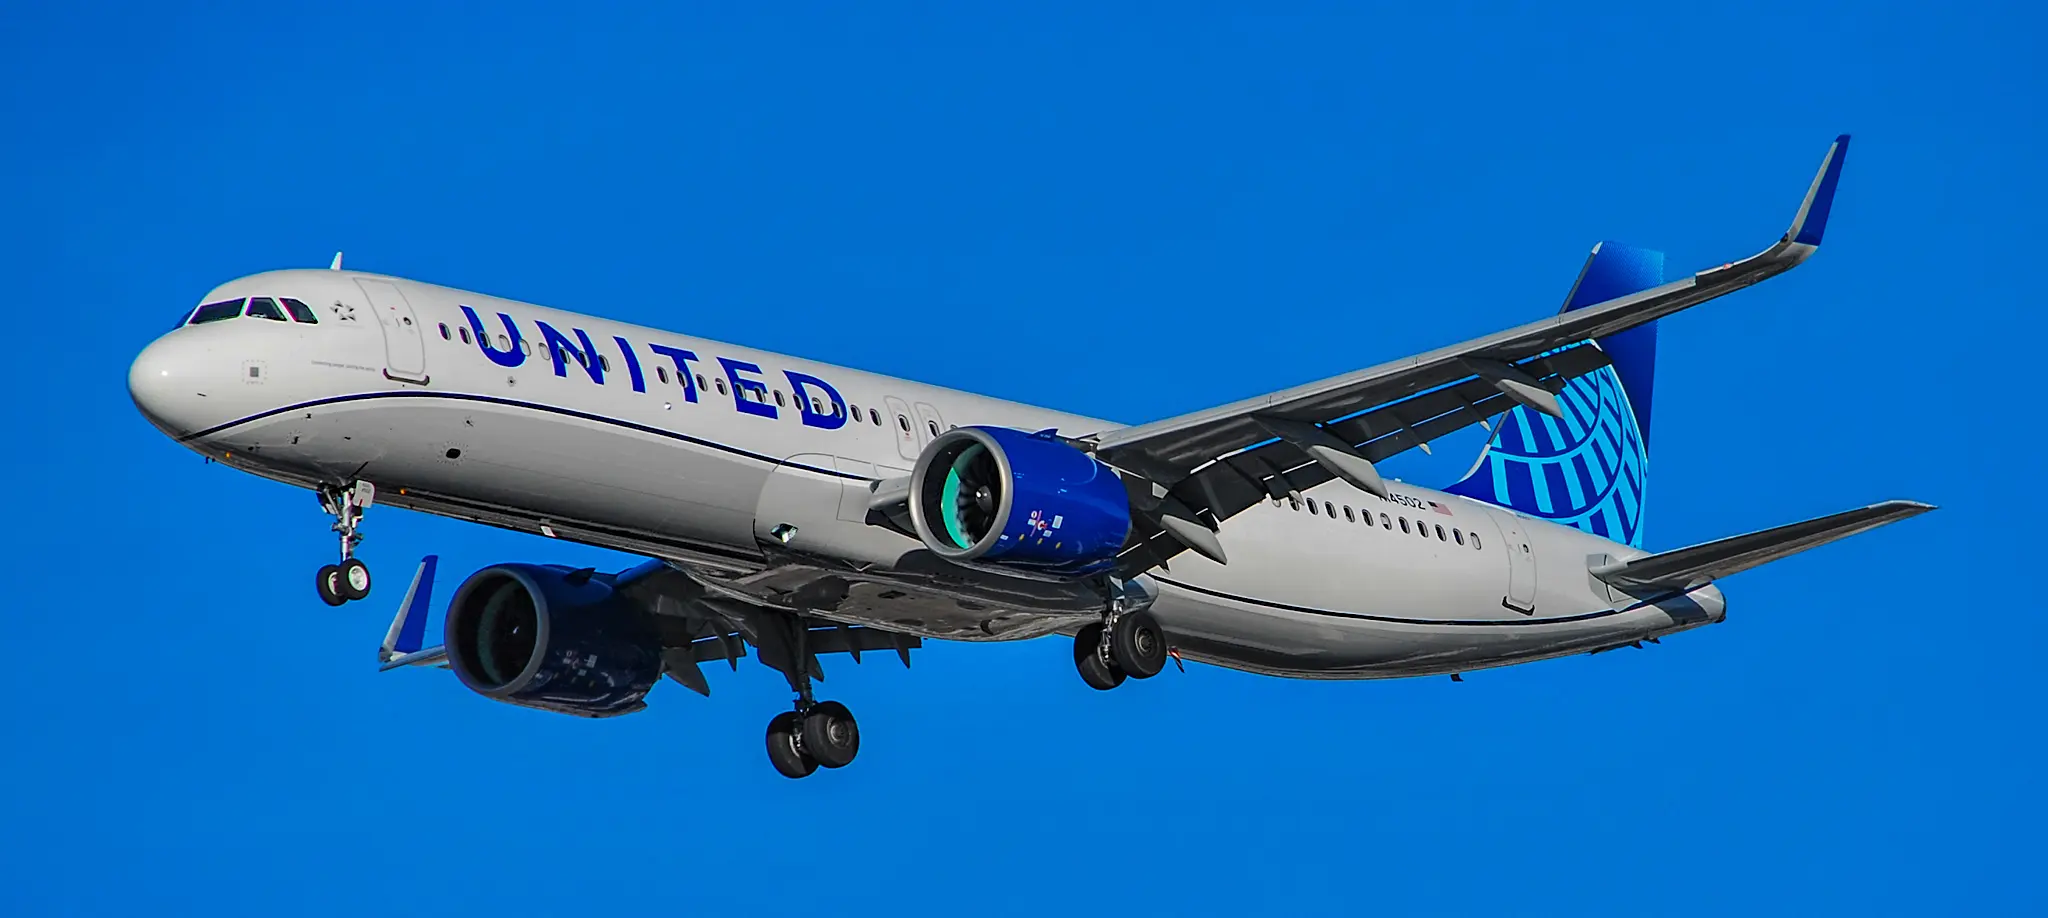
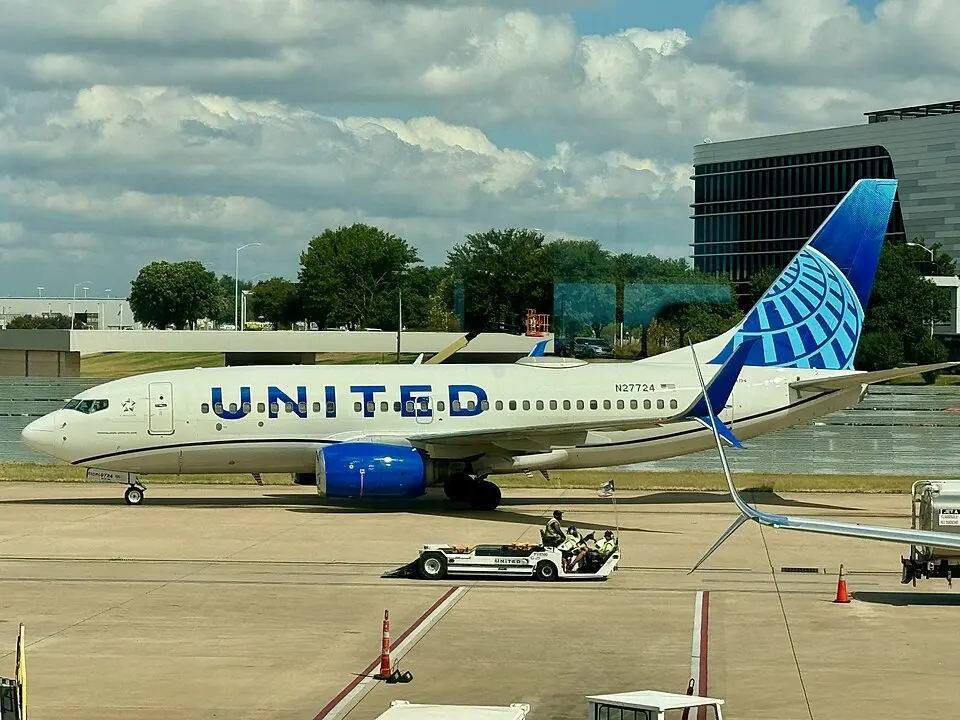
Every carrier flying LAX ⇄ SFO nonstop, combining both directions, ranked by passenger share.


Aircraft flown on this route
Which airplane types operate LAX ⇄ SFO, based on official reporting across both directions.
Flight schedules
Live nonstop schedules in both directions. Switch tabs to see the return leg.
3 flights | Flight | Departs | Duration |
|---|---|---|
| AA 3100 | 9:13pm | 1h 42m |
| AA 3138 | 5:30pm | 1h 32m |
| AA 1110 | 11:01am | 1h 35m |
8 flights | Flight | Departs | Duration |
|---|---|---|
| AS 408 | 8:03pm | 1h 23m |
| AS 519 | 8:20am | 1h 26m |
| AS 539 | 9:35am | 1h 24m |
| AS 726 | 5:00pm | 1h 23m |
| AS 91 | 2:56pm | 1h 21m |
| AS 1375 | 3:56pm | 1h 21m |
| AS 1406 | 1:59pm | 1h 22m |
| AS 1501 | 7:16am | 1h 24m |
11 flights | Flight | Departs | Duration |
|---|---|---|
| UA 469 | 1:25pm | 1h 27m |
| UA 781 | 6:00am | 1h 24m |
| UA 1245 | 11:36am | 1h 27m |
| UA 1195 | 8:21pm | 1h 26m |
| UA 1372 | 7:45am | 1h 32m |
| UA 2019 | 4:10pm | 1h 32m |
| UA 2056 | 9:29pm | 1h 26m |
| UA 2199 | 10:55am | 1h 33m |
| UA 233 | 5:37pm | 1h 32m |
| UA 2681 | 6:45pm | 1h 32m |
| UA 433 | 9:37am | 1h 33m |
15 flights | Flight | Departs | Duration |
|---|---|---|
| WN 3169 | 7:25am | 1h 20m |
| WN 3372 | 12:10pm | 1h 20m |
| WN 1532 | 2:45pm | 1h 15m |
| WN 1316 | 12:15pm | 1h 20m |
| WN 2223 | 8:30pm | 1h 15m |
| WN 2374 | 5:00pm | 1h 15m |
| WN 2400 | 7:35am | 1h 20m |
| WN 2535 | 5:20am | 1h 25m |
| WN 2593 | 10:15am | 1h 20m |
| WN 2797 | 10:45am | 1h 20m |
| WN 2856 | 8:10pm | 1h 20m |
| WN 3085 | 9:00am | 1h 25m |
| WN 3178 | 1:40pm | 1h 20m |
| WN 3939 | 6:30am | 1h 20m |
| WN 3942 | 2:05pm | 1h 20m |
10 flights | Flight | Departs | Duration |
|---|---|---|
| DL 1693 | 8:10pm | 1h 24m |
| DL 672 | 12:50pm | N/A |
| DL 689 | 12:00pm | 1h 25m |
| DL 1421 | 7:05am | 1h 24m |
| DL 1559 | 6:15pm | 1h 15m |
| DL 1715 | 9:30am | 1h 23m |
| DL 2197 | 6:20pm | 1h 20m |
| DL 2267 | 2:35pm | 1h 19m |
| DL 2725 | 12:00pm | 1h 26m |
| DL 2986 | 10:21pm | 1h 19m |
12 flights | Flight | Departs | Duration |
|---|---|---|
| OO 5293 | 6:00am | 1h 30m |
| OO 5582 | 9:29pm | 1h 33m |
| OO 5674 | 6:45pm | 1h 33m |
| OO 3386 | 10:07am | 1h 32m |
| OO 5592 | 9:29pm | 1h 33m |
| OO 5597 | 4:17pm | 1h 33m |
| OO 5690 | 10:35pm | 1h 33m |
| OO 6188 | 11:35am | 1h 37m |
| OO 6274 | 7:20am | 1h 38m |
| OO 6276 | 2:01pm | 1h 29m |
| OO 6277 | 9:41am | 1h 38m |
| OO 6260 | 7:38pm | 1h 38m |
1 flight | Flight | Departs | Duration |
|---|---|---|
| QX 9988 | 5:45am | 1h 23m |
2 flights | Flight | Departs | Duration |
|---|---|---|
| F9 4593 | 7:13pm | 1h 33m |
| F9 2857 | 8:44am | 1h 38m |
Seasonal traffic pattern
Combined passenger volume by month across both directions, showing which months run busiest.
Route Intelligence
Independent metrics on how stable, scarce, and competitive this route is, built from multi-year performance data back to 2022.
2026 Pace
Stable Minor Seasonal Stable Competitive Year-Round Stable Minor Year-Round Watch Competitive Year-Round Watch Minor Semi-Seasonal Watch Minor Year-Round Watch Minor Semi-Seasonal Watch Minor Semi-Seasonal  Sun Country Airlines
  Air Canada
  JetBlue Airways
  Breeze Airways
  Atlas Air
  Aeromexico
  Advanced Air
  Cathay Pacific Airways
  Allegiant Air
  Swiss
Swiss 


Other top routes
More of the highest-volume nonstop routes in the country.
About the Los Angeles–San Francisco Route
A look at why LAX to SFO carries the traffic it does, who flies it, and what to expect onboard.
The California corridor between LAX and SFO is one of the highest-frequency short hops in the country, closer in spirit to a bus route than a typical flight. United and Alaska both run near-hourly service most of the day, and the flight time barely clears an hour gate to gate, which means the route lives and dies on schedule reliability rather than onboard product. Business travelers shuttling between LA's entertainment industry and the Bay Area's tech industry make up a disproportionate share of traffic, and that shows up in how front-loaded bookings are toward early morning and early evening departures. Because the flight is so short, airlines lean on smaller narrowbodies and regional jets here more than on most other routes in this list.
How long is the flight from Los Angeles to San Francisco?
Nonstop flights from Los Angeles to San Francisco take approximately 1 hour gate to gate, making it one of the shortest routes in the country. The flight is so brief that airlines lean on smaller narrowbodies and regional jets here, and on-time performance matters far more than onboard product for this commuter-heavy corridor.
Gallery