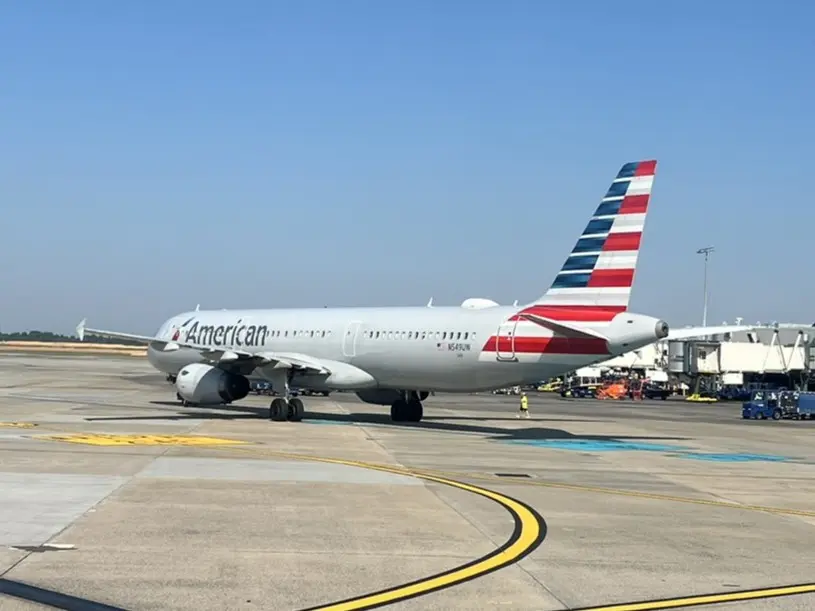
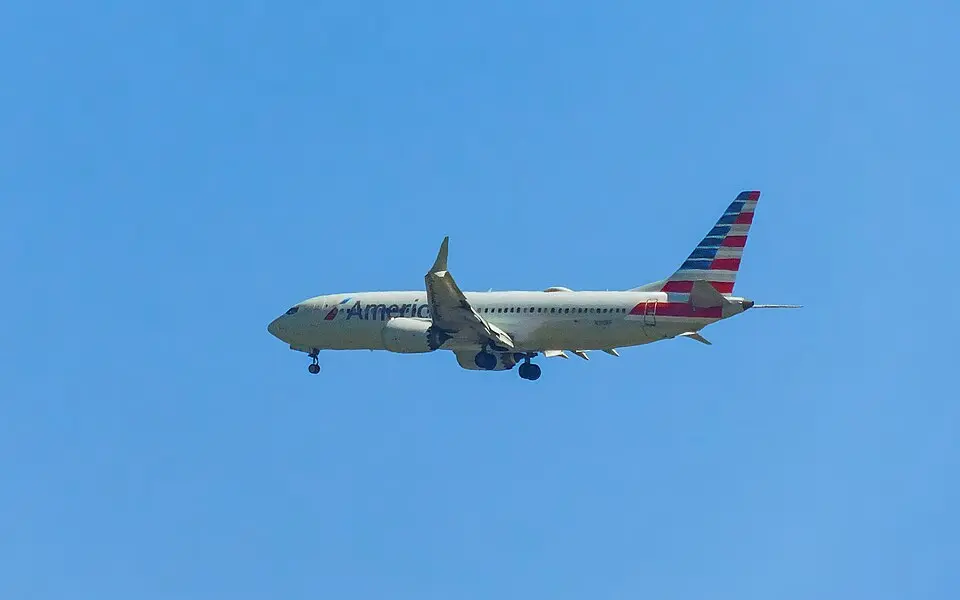
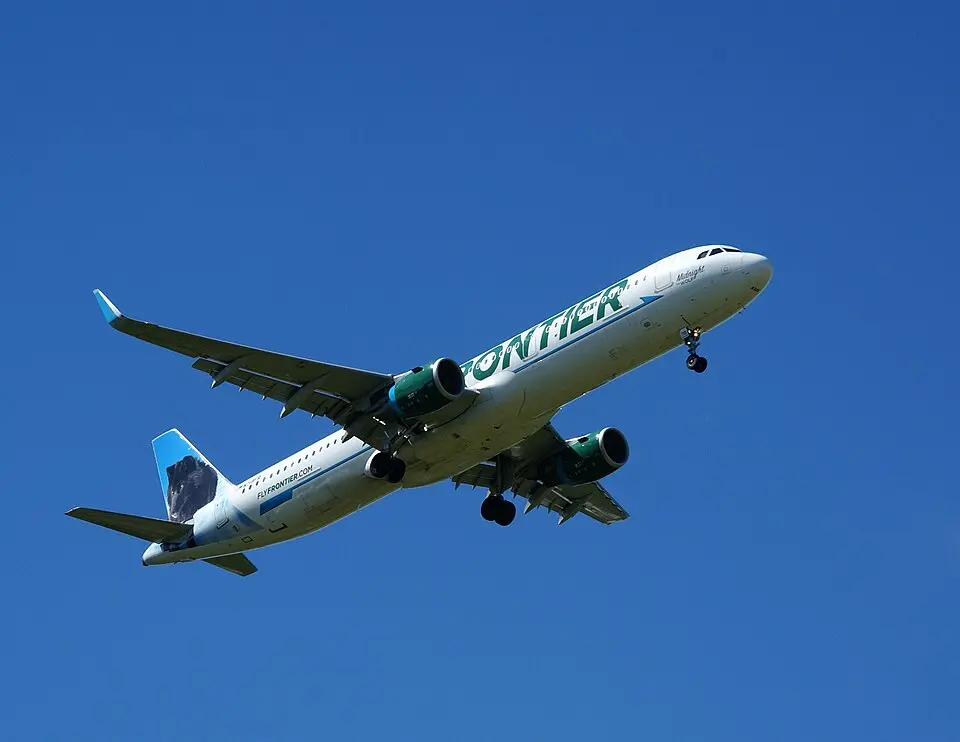
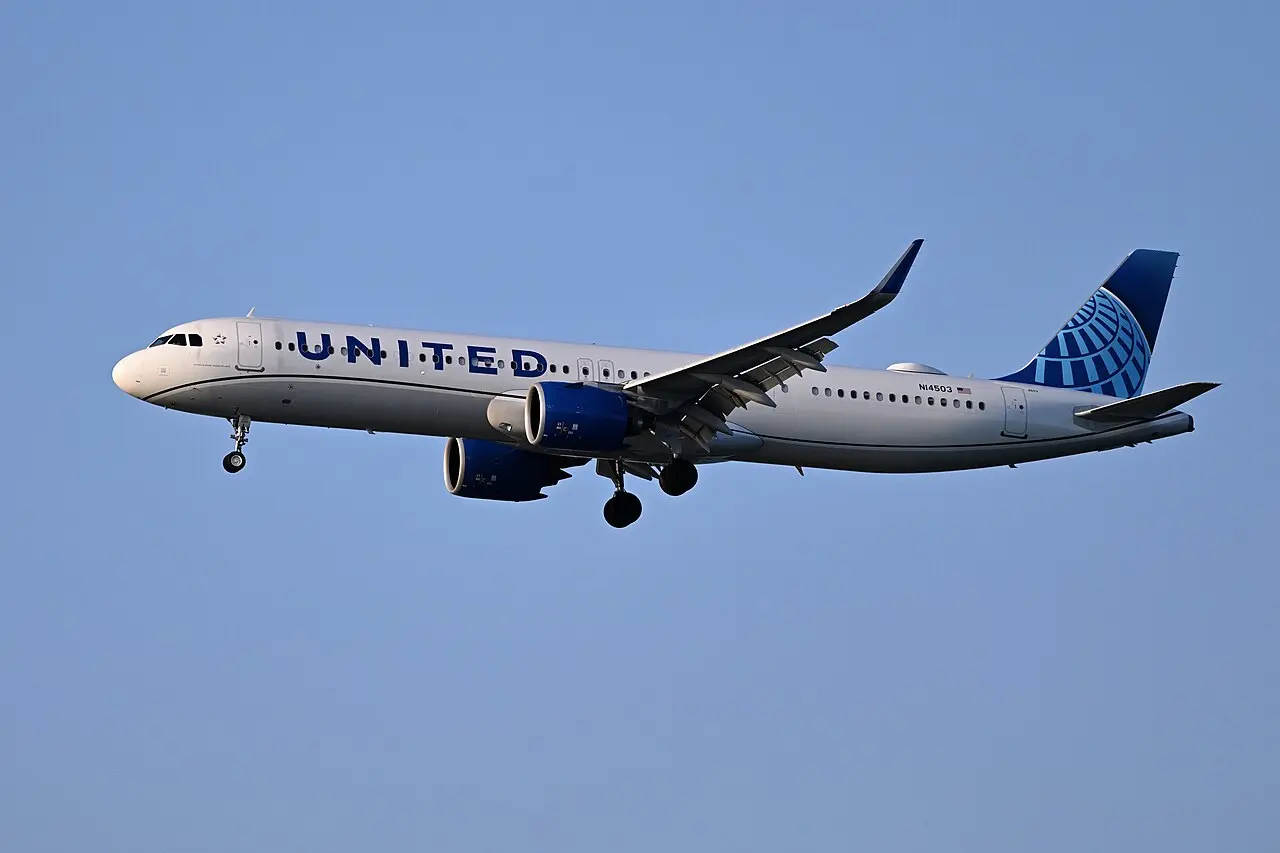
Airlines serving this route
Every carrier flying LAX ⇄ ORD nonstop, combining both directions, ranked by passenger share.


Aircraft flown on this route
Which airplane types operate LAX ⇄ ORD, based on official reporting across both directions.
Flight schedules
Live nonstop schedules in both directions. Switch tabs to see the return leg.
15 flights | Flight | Departs | Duration |
|---|---|---|
| AA 1009 | 10:36pm | 4h 24m |
| AA 2045 | 10:36pm | 4h 24m |
| AA 3192 | 1:20pm | 4h 39m |
| AA 7133 | 12:55am | 4h 21m |
| AA 991 | 10:42pm | 4h 18m |
| AA 1433 | 6:17pm | 4h 13m |
| AA 1598 | 8:00am | 4h 20m |
| AA 1980 | 5:33pm | 4h 26m |
| AA 1998 | 5:12pm | 4h 18m |
| AA 2891 | 11:38am | 4h 27m |
| AA 2998 | 9:29am | 4h 24m |
| AA 3075 | 10:25am | 4h 24m |
| AA 3161 | 11:39pm | 4h 20m |
| AA 3194 | 1:07pm | 4h 40m |
| AA 383 | 6:00am | 4h 22m |
3 flights | Flight | Departs | Duration |
|---|---|---|
| DL 1634 | 3:26pm | 4h 4m |
| DL 2368 | 9:45am | 4h 6m |
| DL 967 | 7:40am | 4h 4m |
1 flight | Flight | Departs | Duration |
|---|---|---|
| F9 2446 | 11:59pm | 4h 18m |
11 flights | Flight | Departs | Duration |
|---|---|---|
| UA 1941 | 7:00am | 4h 15m |
| UA 1946 | 8:15am | 4h 21m |
| UA 1962 | 11:30pm | 4h 12m |
| UA 2113 | 10:44am | 4h 21m |
| UA 2487 | 2:15pm | 4h 18m |
| UA 2780 | 4:55pm | 4h 10m |
| UA 2794 | 3:20pm | 4h 10m |
| UA 353 | 10:35pm | 4h 10m |
| UA 457 | 12:45pm | 4h 20m |
| UA 580 | 5:30am | 4h 16m |
| UA 729 | 12:10am | 4h 10m |
Seasonal traffic pattern
Combined passenger volume by month across both directions, showing which months run busiest.
Route Intelligence
Independent metrics on how stable, scarce, and competitive this route is, built from multi-year performance data back to 2022.
2026 Pace
Stable Competitive Year-Round Stable Dominant Year-Round Stable Minor Highly Seasonal  Spirit Airlines
  SkyWest Airlines
  Sun Country Airlines
  FedEx
FedEx  JetBlue Airways
  Iberia
  Lufthansa
  UPS
UPS  Air Canada
  Air France
  Virgin Atlantic
  Southwest Airlines
  Alaska Airlines
  Atlas Air
Other top routes
More of the highest-volume nonstop routes in the country.
About the Los Angeles–Chicago Route
A look at why LAX to ORD carries the traffic it does, who flies it, and what to expect onboard.
LAX to Chicago links two of the largest hub airports in the American and United networks, and both carriers fly it with a mix of mainline narrowbodies and occasional widebody substitutions during peak demand periods. Unlike the coastal premium transcon routes, this one carries a heavier mix of connecting passengers funneling through O'Hare toward the Midwest and East Coast, which keeps demand more evenly spread across the week rather than concentrated around weekend leisure patterns. The four-hour flight time crosses two time zones, making redeye westbound and early-morning eastbound departures the most schedule-efficient options, and that is exactly where airlines concentrate their widebody-capable gates when they use them on this route.
How long is the flight from Los Angeles to Chicago?
Nonstop flights from Los Angeles to Chicago O'Hare take approximately 4 hours. The four-hour block time crosses two time zones, making redeye westbound and early-morning eastbound departures the most schedule-efficient options for business travelers on both ends.
Gallery